JavaScript Troubleshooting Tools: Ways to Debug a JavaScript Code
Syntax and logical errors are common occurrences while a programming code and many of these mistakes are hard to identify.
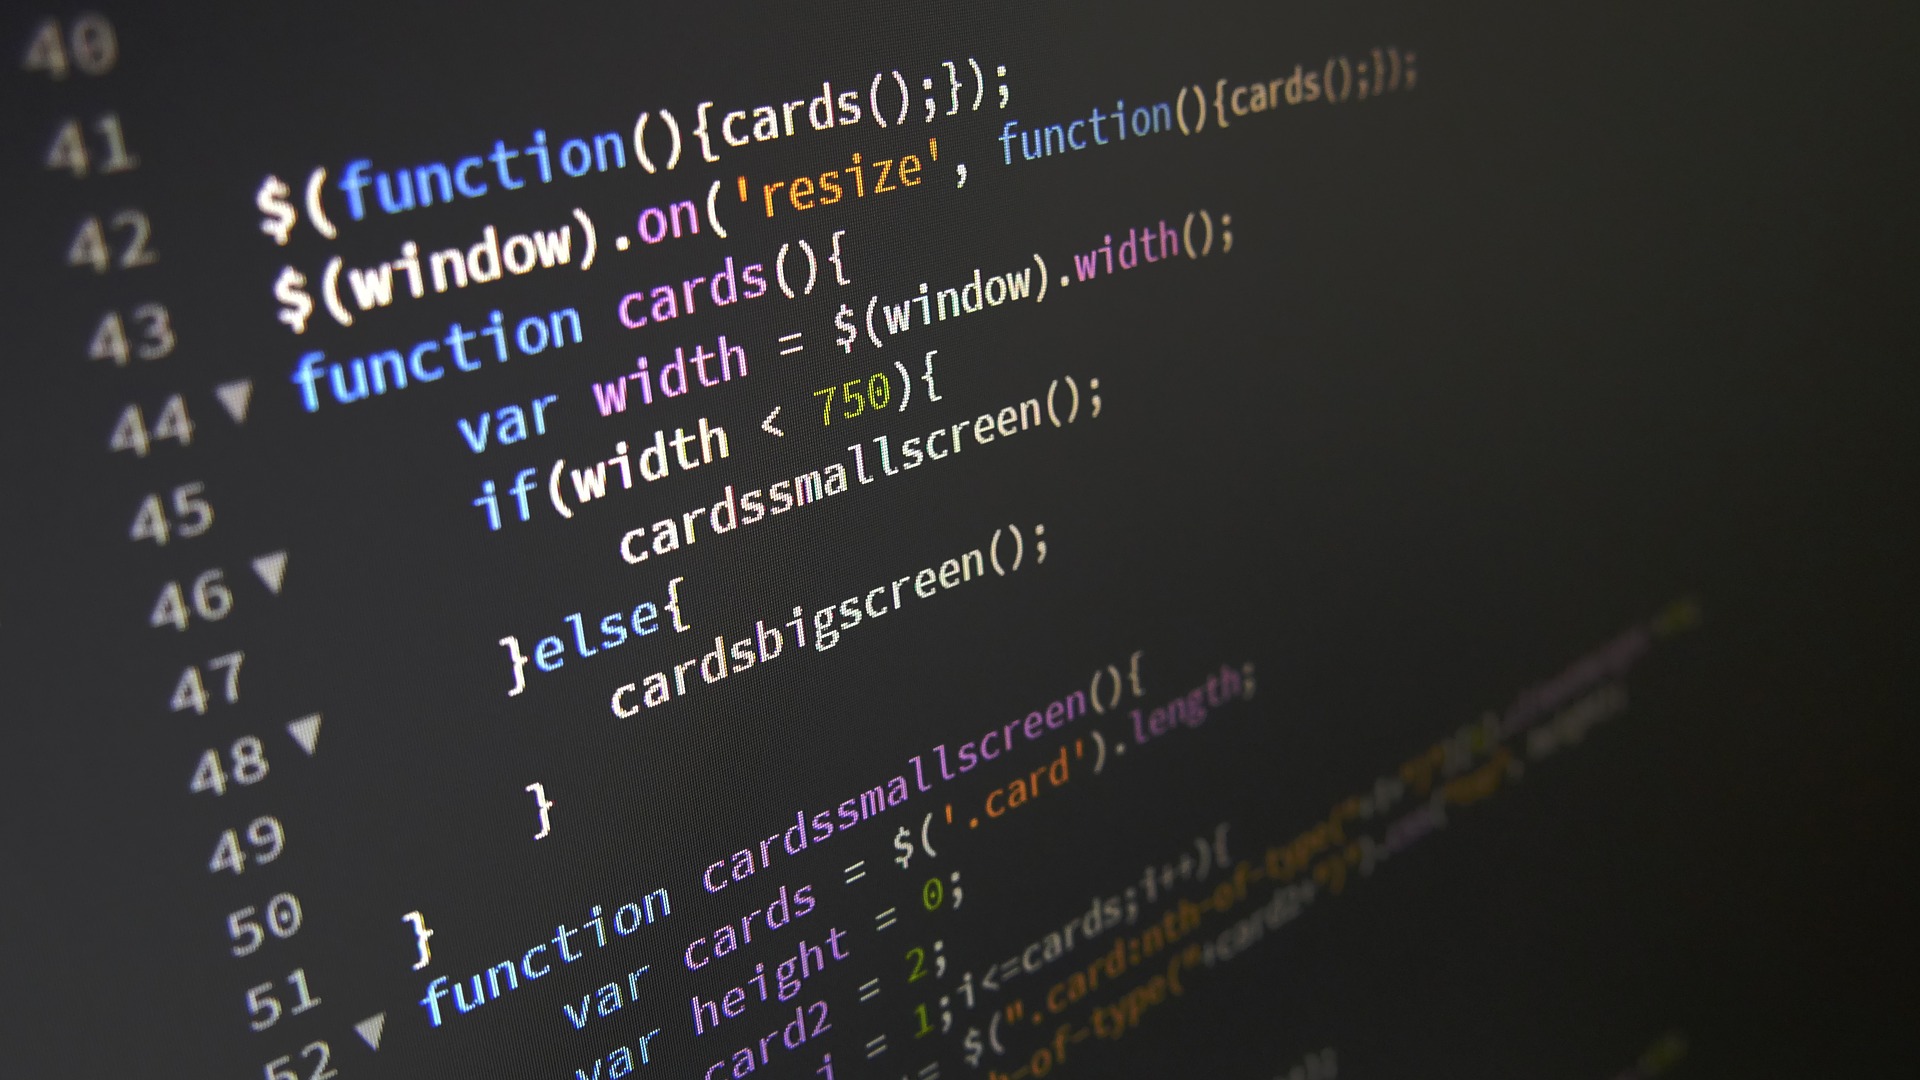
When a code has errors, nothing happens most of the time. There are no error messages, and there are no hints as to where to look for them.
Code debugging is the process of looking for and addressing mistakes in programming code.
Debugging in JavaScript
Debugging is a difficult task. Fortunately, every recent browser includes a JavaScript debugger.
Built-in debuggers can be switched on and off, requiring the user to find and correct.
You may also use a debugger to establish breakpoints i.e., points where code execution can be halted, and inspect parameters while the code is running.
Normally, you enable debugging in your browser with the F12 key and pick “Console” from the debugger menu. But you can also follow any of the techniques below as well.
The console.log() Method
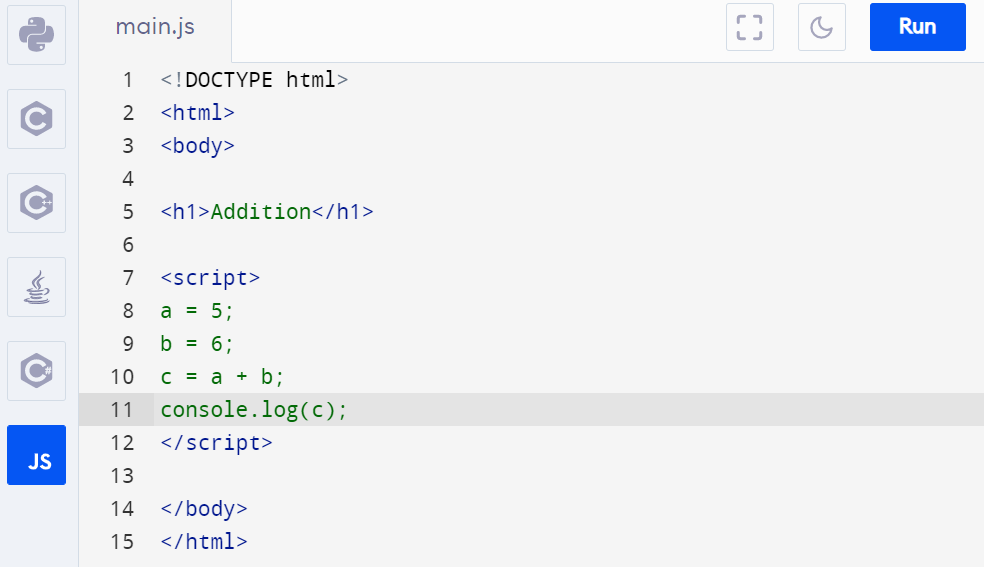
If your debugging is supported by your browser, you can use console.log() to show JavaScript values in the debugger window.
Establishing Breakpoints
Breakpoints in JavaScript code can be defined in the debugger window.
JavaScript will halt execution at each breakpoint, allowing you to inspect JavaScript values.
You can continue program execution after checking values.
Debugger
The debugger is a keyword that pauses JavaScript execution and invokes the debugging function (if one is present). The concept here is similar to that in the previous point.
The debugger statement has no effect if no debugging is needed.
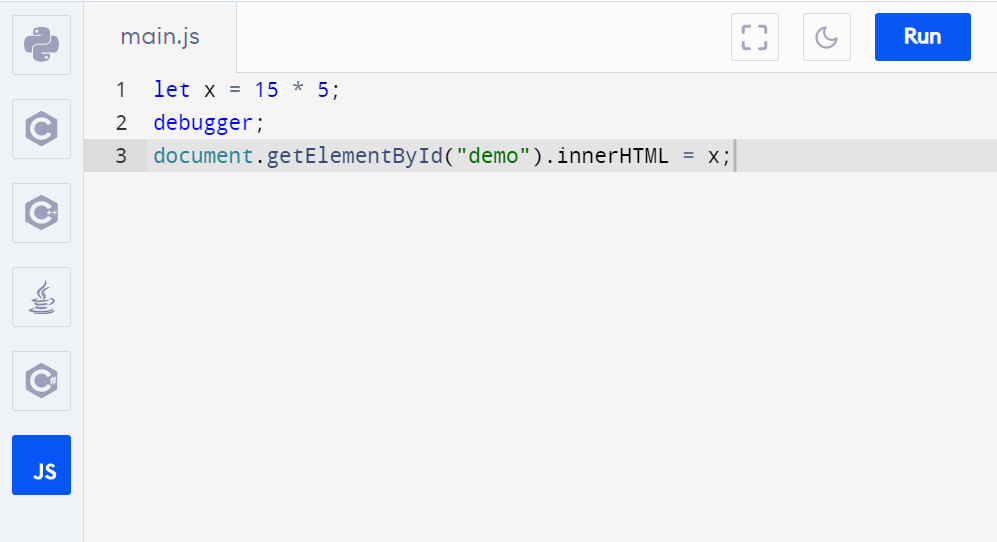
In the example above, this code will stop execution before it reaches the third line if the debugger is enabled.
Unminify your code
If you have a problem in development, it is possible that your source maps did not actually reach the server. Chrome may unminify Javascript files and translate them to a more coherent form. The code will not be as useful as your real code, but you will be able to see what is going on.

In conclusion, there are numerous methods for debugging JavaScript code. Some of them are listed above. You should now be able to utilize these pointers to begin debugging your JavaScript code and ensuring that it is bug-free and ready to push and ship!


